

Monitor refiroo
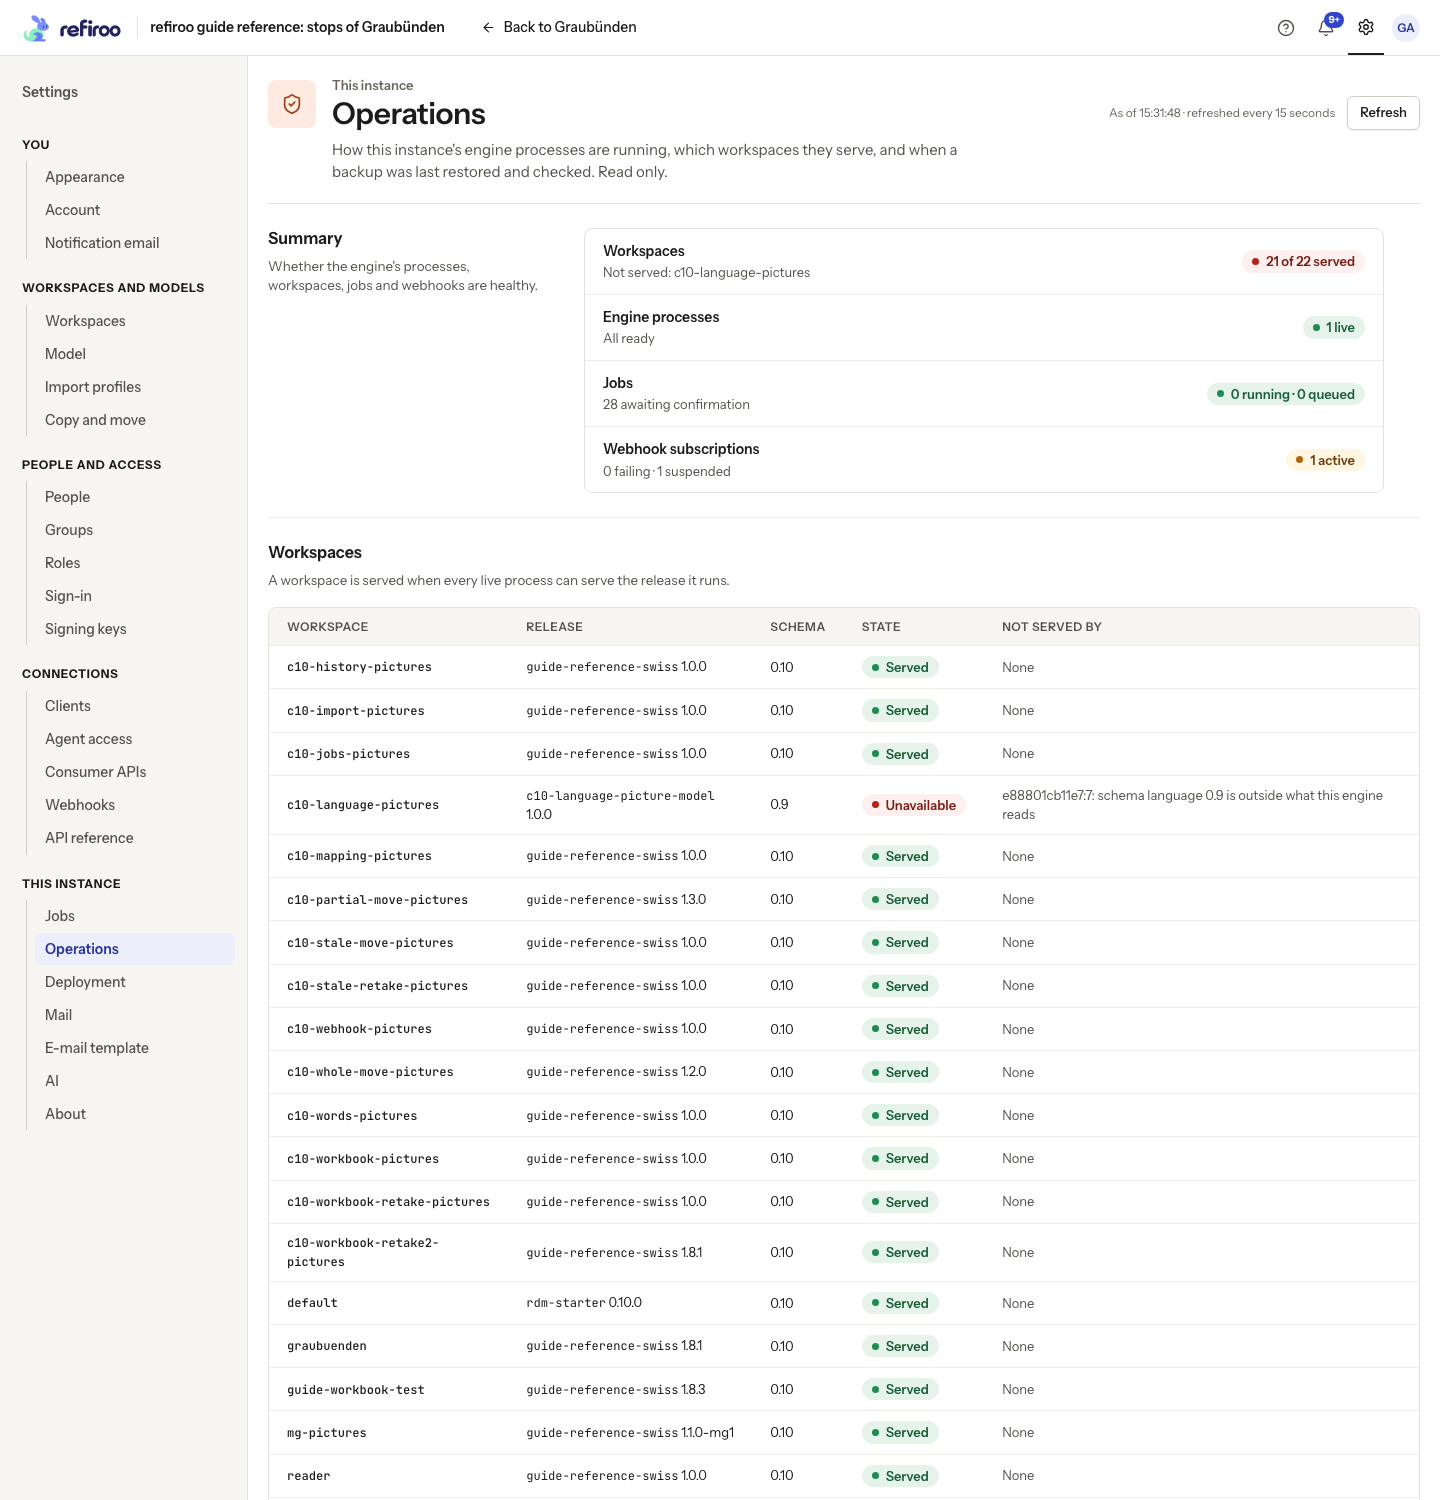
Start with Settings › This instance › Operations, available with Operations access. It shows workspaces served or unavailable, live and silent processes, jobs, and webhook subscription states. Below the totals are workspace failures, process threads and pool use, the latest backup rehearsal, and probe addresses. It refreshes every 15 seconds while visible; Refresh reads again immediately. A failed refresh preserves the previous figures and says when they were read.
Read the Operations page
Section titled “Read the Operations page”- Read the summary figures for workspaces, processes, jobs and webhook subscriptions. Check As of before acting on the figures. Refresh reads immediately; automatic refresh runs every 15 seconds while the page is visible. Could not refresh means the previous figures remain on screen and may be stale.
- In Workspaces, read Workspace, Release, Schema, State and Not served by.
Served means every live process can serve that workspace’s release. Unavailable identifies
a missing release or the processes and reasons preventing service. Overall
/healthcan still pass while a workspace row is unavailable. Follow startup recovery. - Expand a row under Engine processes. It shows the engine version, start and last report, Live or Silent, and Ready, Ready at last report or Not ready. A silent process’s former readiness is historical. Background threads distinguishes Running, Failing (with reason and time) and Off. Off can be expected for a disabled capability or while no workspace is servable; failing calls for investigation.
- Read Database connections as connections in use against pool size plus overflow, with counts of connection failures. Requests since start counts answers and server errors for that process. Releases it cannot serve names blocked releases and their reason. These counters restart with a new process; they are not a durable audit log.
- Use Last backup rehearsal to inspect recovery evidence, as explained in Back up and restore.
- Under For monitoring, use the Copy control beside Liveness, Readiness or Metrics. Probe addresses reflect the browser’s API address. The public Compose entry blocks Metrics; configure the scraper with an internal engine address instead.
The page is read only. It cannot stop a process, change settings, run a backup or restore data. Use the operator commands for those tasks. Operations access covers monitoring, not editing people, mail or subscriptions; those tasks need their own grants.
Collect logs
Section titled “Collect logs”docker compose logs --tail=100 engine| Setting | Default | When to change it |
|---|---|---|
LOG_FORMAT |
text |
Set json for one object per line in a log collector. Other values refuse startup. |
LOG_LEVEL |
INFO |
Choose DEBUG, INFO, WARNING or ERROR. Temporarily use DEBUG for detailed causes; protect those logs. |
PROCESS_HEARTBEAT_SECONDS |
15 |
Interval between process reports; change with failure-detection latency in mind. |
Logs go to standard error. JSON records include UTC time, level, logger, message, process and thread;
requests also include requestId, method and route. Access lines add status and durationMs.
Probe and metrics access lines are DEBUG to keep normal logs small.
Use the response’s X-Request-Id or an error’s correlationId to locate its log records. A supplied
request ID is accepted only when it is 1–64 letters, digits, dots, underscores or hyphens; otherwise
the engine creates one. Expected operational failures have concise normal logs; DEBUG retains
underlying tracebacks. Avoid putting secrets into support reports.
Scrape metrics privately
Section titled “Scrape metrics privately”GET /metrics on the internal engine address returns Prometheus text for the whole instance, including all live processes.
Scrape once through an engine address reachable on the private network; scraping each process
repeats the same instance series. The public Compose web service returns 404 HTML from nginx for /metrics, even with a valid management token. This is the expected response at the public address; keep /metrics as the path and use the private engine address for scraping.
Create a monitoring client with the Operator role in your configured environment:
docker compose run --rm engine python -m app.cli.create_client \ --name "Monitoring" --role operatorStore the printed secret once in the monitoring system’s secret store. Configure Prometheus OAuth2
client credentials against /oauth/token, using the default management scope, or a bearer
credentials file that your token-refresh mechanism maintains. Tokens last 60 minutes by default;
a static expired token stops scrapes. See Clients and the
API reference for authentication operations.
For a first scrape test, obtain a management ACCESS_TOKEN with this client using
the token commands. From the
Compose checkout, pipe it to a probe inside the running engine container:
printf '%s' "$ACCESS_TOKEN" | docker compose exec -T engine python -c \ 'import sys,urllib.request; token=sys.stdin.read(); request=urllib.request.Request("http://engine:8000/metrics",headers={"Authorization":"Bearer "+token}); print(urllib.request.urlopen(request,timeout=10).read().decode())'Expect Prometheus text including rdm_process_ready{...} 1 for a ready process. The token
is read from stdin and is not printed. A 401 needs a fresh valid management token; a 403
needs the Operator grant. A public /metrics 404 is expected, even with a token. Keep the
engine port private. Clear the temporary token with unset ACCESS_TOKEN after testing.
The metrics response uses Prometheus text exposition format version 0.0.4.
Read the same figures as JSON
Section titled “Read the same figures as JSON”Use these read-only operations to investigate an incident or collect structured monitoring results.
Send a management bearer token with the instance Operator grant, as for the scraper above.
All four require Operations access (operations.read) at the instance; sign-in alone is
not enough. See the system field reference.
They do not start jobs or restore backups. For paged results, follow the page’s links until
all items have been read before calculating totals.
Engine processes
Section titled “Engine processes”GET /api/v1/system/processes returns every engine process on this database in ID order.
pageSize defaults to 100 and accepts at most 500. The answering process reports itself first,
so its figures are current; other processes’ figures date from their last heartbeat.
Each item corresponds to a row under Engine processes:
| JSON fields | What to read |
|---|---|
id, host, pid |
Identity: host:pid:random, host and operating-system process ID. A restart creates a new identity. |
engineVersion, startedAt, heartbeatAt |
Engine version, start time and last report. |
state, ready |
live or silent, and whether it serves at least one workspace’s model. Silent readiness is historical. |
threads |
Background threads: each has name, state (running, failing, off), optional failure reason and since time. |
pool |
Database connections: size, maxOverflow, inUse (connections checked out when reported). |
unavailableReleases |
Releases it cannot serve: each has releaseId, schemaVersion and reason. |
counters |
Requests since start: requests, serverErrors (5xx answers), and databaseUnavailable, counts by reason. Counters reset with a new process. |
Thread names are jobWorker, exportWorker, assistantWorker, jobListener, eventDeriver,
webhookDispatcher, mailSender and heartbeat. Failure reasons are poolExhausted,
tooManyConnections, transactionEnded, unreachable or error. An off thread has not
started in this process: its capability may be disabled or no workspace may be servable.
A process is silent after three PROCESS_HEARTBEAT_SECONDS intervals without a report.
A clean stop removes it; a process that died remains listed silent for a day.
Check the host and logs before relying on a silent process’s old figures.
Workspace readiness
Section titled “Workspace readiness”GET /api/v1/system/readiness lists active workspaces in key order. pageSize defaults
to 100, at most 500. Each item has workspaceKey, its release (id, key, version,
schemaVersion, or null for none), state (served or unavailable) and unavailableIn.
This is the Workspaces table; Not served by comes from unavailableIn, which lists
live processes unable to serve the release, each with processId, schemaVersion and reason.
unsupportedSchema means the schema is outside that engine’s supported window; invalid
means model validation failed; notLoaded means an activated release has not loaded in
that process and needs a restart. No release also makes a workspace unavailable.
Follow startup recovery for the next action.
Instance totals
Section titled “Instance totals”GET /api/v1/system/summary is not paged. It counts the same instance figures as the
instance gauges of /metrics, now: processes (live, silent), workspaces (served,
unavailable), jobs, and webhookSubscriptions (active, failing, suspended).
Each jobs entry has kind, state and count, for queued, running or
awaiting_confirmation. Kind/state combinations with no jobs are omitted. Treat an omitted
combination as zero in a dashboard rather than carrying forward an earlier count.
Backup rehearsals
Section titled “Backup rehearsals”GET /api/v1/system/backup-rehearsals lists checks made with
python -m app.cli.restore_check against backups restored into separate databases,
newest first. pageSize defaults to 20, at most 200. These are the results in
Last backup rehearsal, not a list of backup files on disk.
Each gives id, checkedAt, result (passed or failed), supplied backup name,
dataAsOf (the copy’s newest audit change), revisionBefore, revisionAfter,
engineVersion and host. Backup name and data time may be null; revisionAfter
is null if the copy was not prepared. A failure includes failure.code and
failure.message, explaining what recovery would meet and what to do.
Each item in workspaces gives the copy’s workspaceKey, release, state (served
or unavailable), and reason (unsupportedSchema, invalid, noRelease, or null).
records, relations, openChangeSets and publications count the restored copy;
liveRecords counts that workspace’s records in the live instance when checked.
Relationships are counted by their source workspace. Different counts alone do not fail
the rehearsal. Follow the rehearsal procedure and failure-code actions
for a failed or outdated check; reading this operation never performs one.
Choose alerts
Section titled “Choose alerts”| Signal | What to investigate |
|---|---|
rdm_workspaces_unavailable > 0 |
Release schema, model validity and processes failing to load a workspace. |
rdm_process_ready = 0 |
Readiness and startup messages. |
rdm_processes{state="silent"} > 0 |
Missing heartbeats; a process may have crashed or lost database access. |
Rising rdm_database_unavailable_total |
Its reason: pool exhaustion, server connection ceiling, ended transaction or unreachable database. |
rdm_background_thread_failing = 1 for minutes |
The named thread’s reason and logs. |
Growing rdm_jobs{state="queued"} |
Worker state, capability switch, leases and sustained demand. |
rdm_webhook_subscriptions{state="suspended"} > 0 |
Subscription reason, receiver health and retained event positions. |
Request counts and duration histograms are rdm_http_requests_total and
rdm_http_request_duration_seconds. Pool size, overflow and checked-out connections are exposed
under rdm_database_pool_*. Process counters restart with a new process label. Labels do not
include individual records or workspaces. Tune alert thresholds to your own measured workload;
production capacity and latency targets are not measured for your installation.
A process becomes silent after three heartbeat intervals, normally 45 seconds. Clean stops remove the row; crashed rows expire after a day. Other processes’ figures can be one heartbeat old. Use liveness and readiness probes alongside these metrics.
Metrics reference
Section titled “Metrics reference”Every process metric below includes the process label. Its value identifies a host, PID and
random suffix; restarting makes a new series. Other processes’ samples can be one heartbeat old.
Instance gauges have only the labels listed in the table and are counted when scraped. Missing
series for work that has never happened are not necessarily zero-valued samples.
| Metric | Kind | Labels in addition to process |
Meaning |
|---|---|---|---|
rdm_process_ready |
Gauge | version |
1 when the process is ready, 0 otherwise. |
rdm_process_start_time_seconds |
Gauge | None | Start time as Unix seconds. |
rdm_http_requests_total |
Counter | method, route, status |
Completed answers, using the route template or unmatched, never a record-specific path. |
rdm_http_request_duration_seconds |
Histogram | route; buckets also have le |
Time until response handling finishes, including a streamed response’s duration. |
rdm_database_unavailable_total |
Counter | reason |
Request connection refusals and background outages begun; reasons are poolExhausted, tooManyConnections, transactionEnded, unreachable. |
rdm_database_pool_size |
Gauge | None | Configured persistent pool size. |
rdm_database_pool_max_overflow |
Gauge | None | Configured extra busy-period connections. |
rdm_database_pool_connections_in_use |
Gauge | None | Connections checked out at the process’s report. |
rdm_background_thread_failing |
Gauge | thread |
1 when a started thread is failing, 0 otherwise; off threads have no sample. |
rdm_releases_unavailable |
Gauge | None | Releases used by workspaces that this process cannot serve. |
| Instance metric | Kind | All labels | Meaning |
|---|---|---|---|
rdm_processes |
Gauge | state |
Number of live and silent processes. |
rdm_jobs |
Gauge | kind, state |
Jobs queued, running or awaiting_confirmation, by kind. |
rdm_webhook_subscriptions |
Gauge | state |
Subscriptions active, failing (retrying) or suspended. |
rdm_workspaces_unavailable |
Gauge | None | Active workspaces missing a release or unavailable in some live process. |
The histogram exports _bucket, _sum and _count series. Bucket bounds, in seconds, are
0.005, 0.01, 0.025, 0.05, 0.1, 0.25, 0.5, 1, 2.5, 5, 10 and +Inf.
Buckets are cumulative; le is the upper bound. An illustrative excerpt from an instance with one
process is:
# TYPE rdm_process_ready gaugerdm_process_ready{process="host:123:example",version="0.16.0"} 1# TYPE rdm_http_requests_total counterrdm_http_requests_total{process="host:123:example",method="GET",route="/api/v1/workspaces",status="200"} 4# TYPE rdm_workspaces_unavailable gaugerdm_workspaces_unavailable 0Configure a scraper attached to the private Compose network. Its engine:8000 name resolves there,
not from an arbitrary external monitoring host. For example, a Prometheus scrape job can use:
scrape_configs: - job_name: refiroo metrics_path: /metrics static_configs: - targets: ["engine:8000"] oauth2: client_id: "REPLACE_WITH_MONITORING_CLIENT_ID" client_secret_file: /etc/prometheus/secrets/refiroo-client-secret token_url: http://engine:8000/oauth/tokenPut only the client’s secret in that protected file; grant the client the instance Operator role.
The HTTP hop above stays on the private network. Use protected HTTPS connectivity for a scraper
outside that trust boundary. Expect rdm_process_ready and a successful scrape. A 401 requires
checking client credentials or token expiry; 403 requires the Operator grant; public 404 means the
scraper hit web instead of the internal engine. Do not expose port 8000 to repair a scrape.
Log field reference and examples
Section titled “Log field reference and examples”With JSON format, all lines have the first six fields. Request context and access fields appear only where applicable. Other log messages may add fields relevant to that event.
| Field | Example | Meaning |
|---|---|---|
time |
2026-11-03T10:00:00.123+00:00 |
UTC timestamp with millisecond precision. |
level |
INFO |
Log severity. |
logger |
app.access |
Source logger; access lines replace uvicorn access logging. |
message |
GET /api/v1/workspaces 200 12.3 ms |
Human-readable event. |
process |
123 |
OS process ID; differs from the metrics process identity. |
thread |
MainThread |
Thread that wrote the event. |
requestId |
operator-check |
Request correlation reference, when in a request. |
method |
GET |
Request method. |
route |
/api/v1/workspaces |
Matched route template when available; context can use the path before routing. |
path |
/api/v1/workspaces |
Access record’s actual request path. |
status |
200 |
Access record’s HTTP status. |
durationMs |
12.3 |
Access record’s elapsed time, in milliseconds. |
exception |
Traceback text | Present only when logged with exception details; expected operational failure traces are DEBUG. |
Illustrative lines for the same request in the two formats:
2026-11-03 10:00:00,123 INFO app.access: GET /api/v1/workspaces 200 12.3 ms [request operator-check]{"time": "2026-11-03T10:00:00.123+00:00", "level": "INFO", "logger": "app.access", "message": "GET /api/v1/workspaces 200 12.3 ms", "process": 123, "thread": "MainThread", "requestId": "operator-check", "method": "GET", "route": "/api/v1/workspaces", "path": "/api/v1/workspaces", "status": 200, "durationMs": 12.3}To trace a harmless probe, temporarily enable DEBUG, recreate the engine and send:
curl -i -H 'X-Request-Id: operator-check' https://refiroo.example.org/healthdocker compose logs --tail=200 engineExpect X-Request-Id: operator-check in the response and the same reference in the access line.
Restore INFO and recreate after diagnosis. The text timestamp uses the process’s local logging
clock; JSON explicitly writes UTC. Retain logs using the container platform or your collector;
refiroo supplies no deployment-wide log rotation or archive policy. Do not leave unbounded debug
capture running. All three logging/reporting settings above are non-secret and need recreation.
Watch AI and agent calls
Section titled “Watch AI and agent calls”Settings › This instance › AI needs Operations access and lists each provider call and assistant turn with its purpose, requester, outcome, tokens, reported cost and duration. Totals cover 30 days. This is usage evidence, not a billing statement. Send a test request checks only the provider and sends no reference data; test a real assistant task separately. Read the failure sentence before retrying; a provider failure leaves ordinary work available.
For external assistants, a security administrator uses Settings › Connections › Agent access. Its separate call list shows answered, refused, limited and failed calls, including argument names but never values. Use its request identifier when tracing a failure. See AI and agent settings for send policy, cost, retention and revocation. Logging provider content is optional and can retain sensitive reference data; do not enable it merely to collect call counts.
Keep monitoring history and retire a scraper
Section titled “Keep monitoring history and retire a scraper”refiroo exposes current metrics; it does not store a Prometheus time series archive. The Operations page’s process reports and counters are not a replacement for your monitoring history. Set metric retention, storage capacity and backups in Prometheus or your monitoring platform. A rebuilt engine cannot restore the old process’s in-memory counters from a database backup.
Keep log retention separate from JOB_RETENTION_DAYS, feed retention and webhook delivery-log
retention. Those settings do not rotate container logs or shorten a metrics archive. The reference
Compose files do not set a Docker logging rotation policy. Configure bounded retention in the
container platform or collector for engine, web, database and Caddy, and watch the host disk too.
Avoid leaving DEBUG enabled after diagnosis.
When replacing the monitoring client secret, update the scraper’s protected secret file and verify fresh token acquisition and successful scrapes before retiring the old secret where overlap is available. Use the client administration workflow. To remove a scraper, remove its scrape job and deactivate its dedicated client. This stops new collection; retained metrics and logs remain under the collector’s own retention policy. Removing monitoring grants does not stop the engine or erase application records.